Overview
- This article explains the Cab9 Dashboard.
- How to filter data to see more relevent information.
Cab9 Dashboard
1
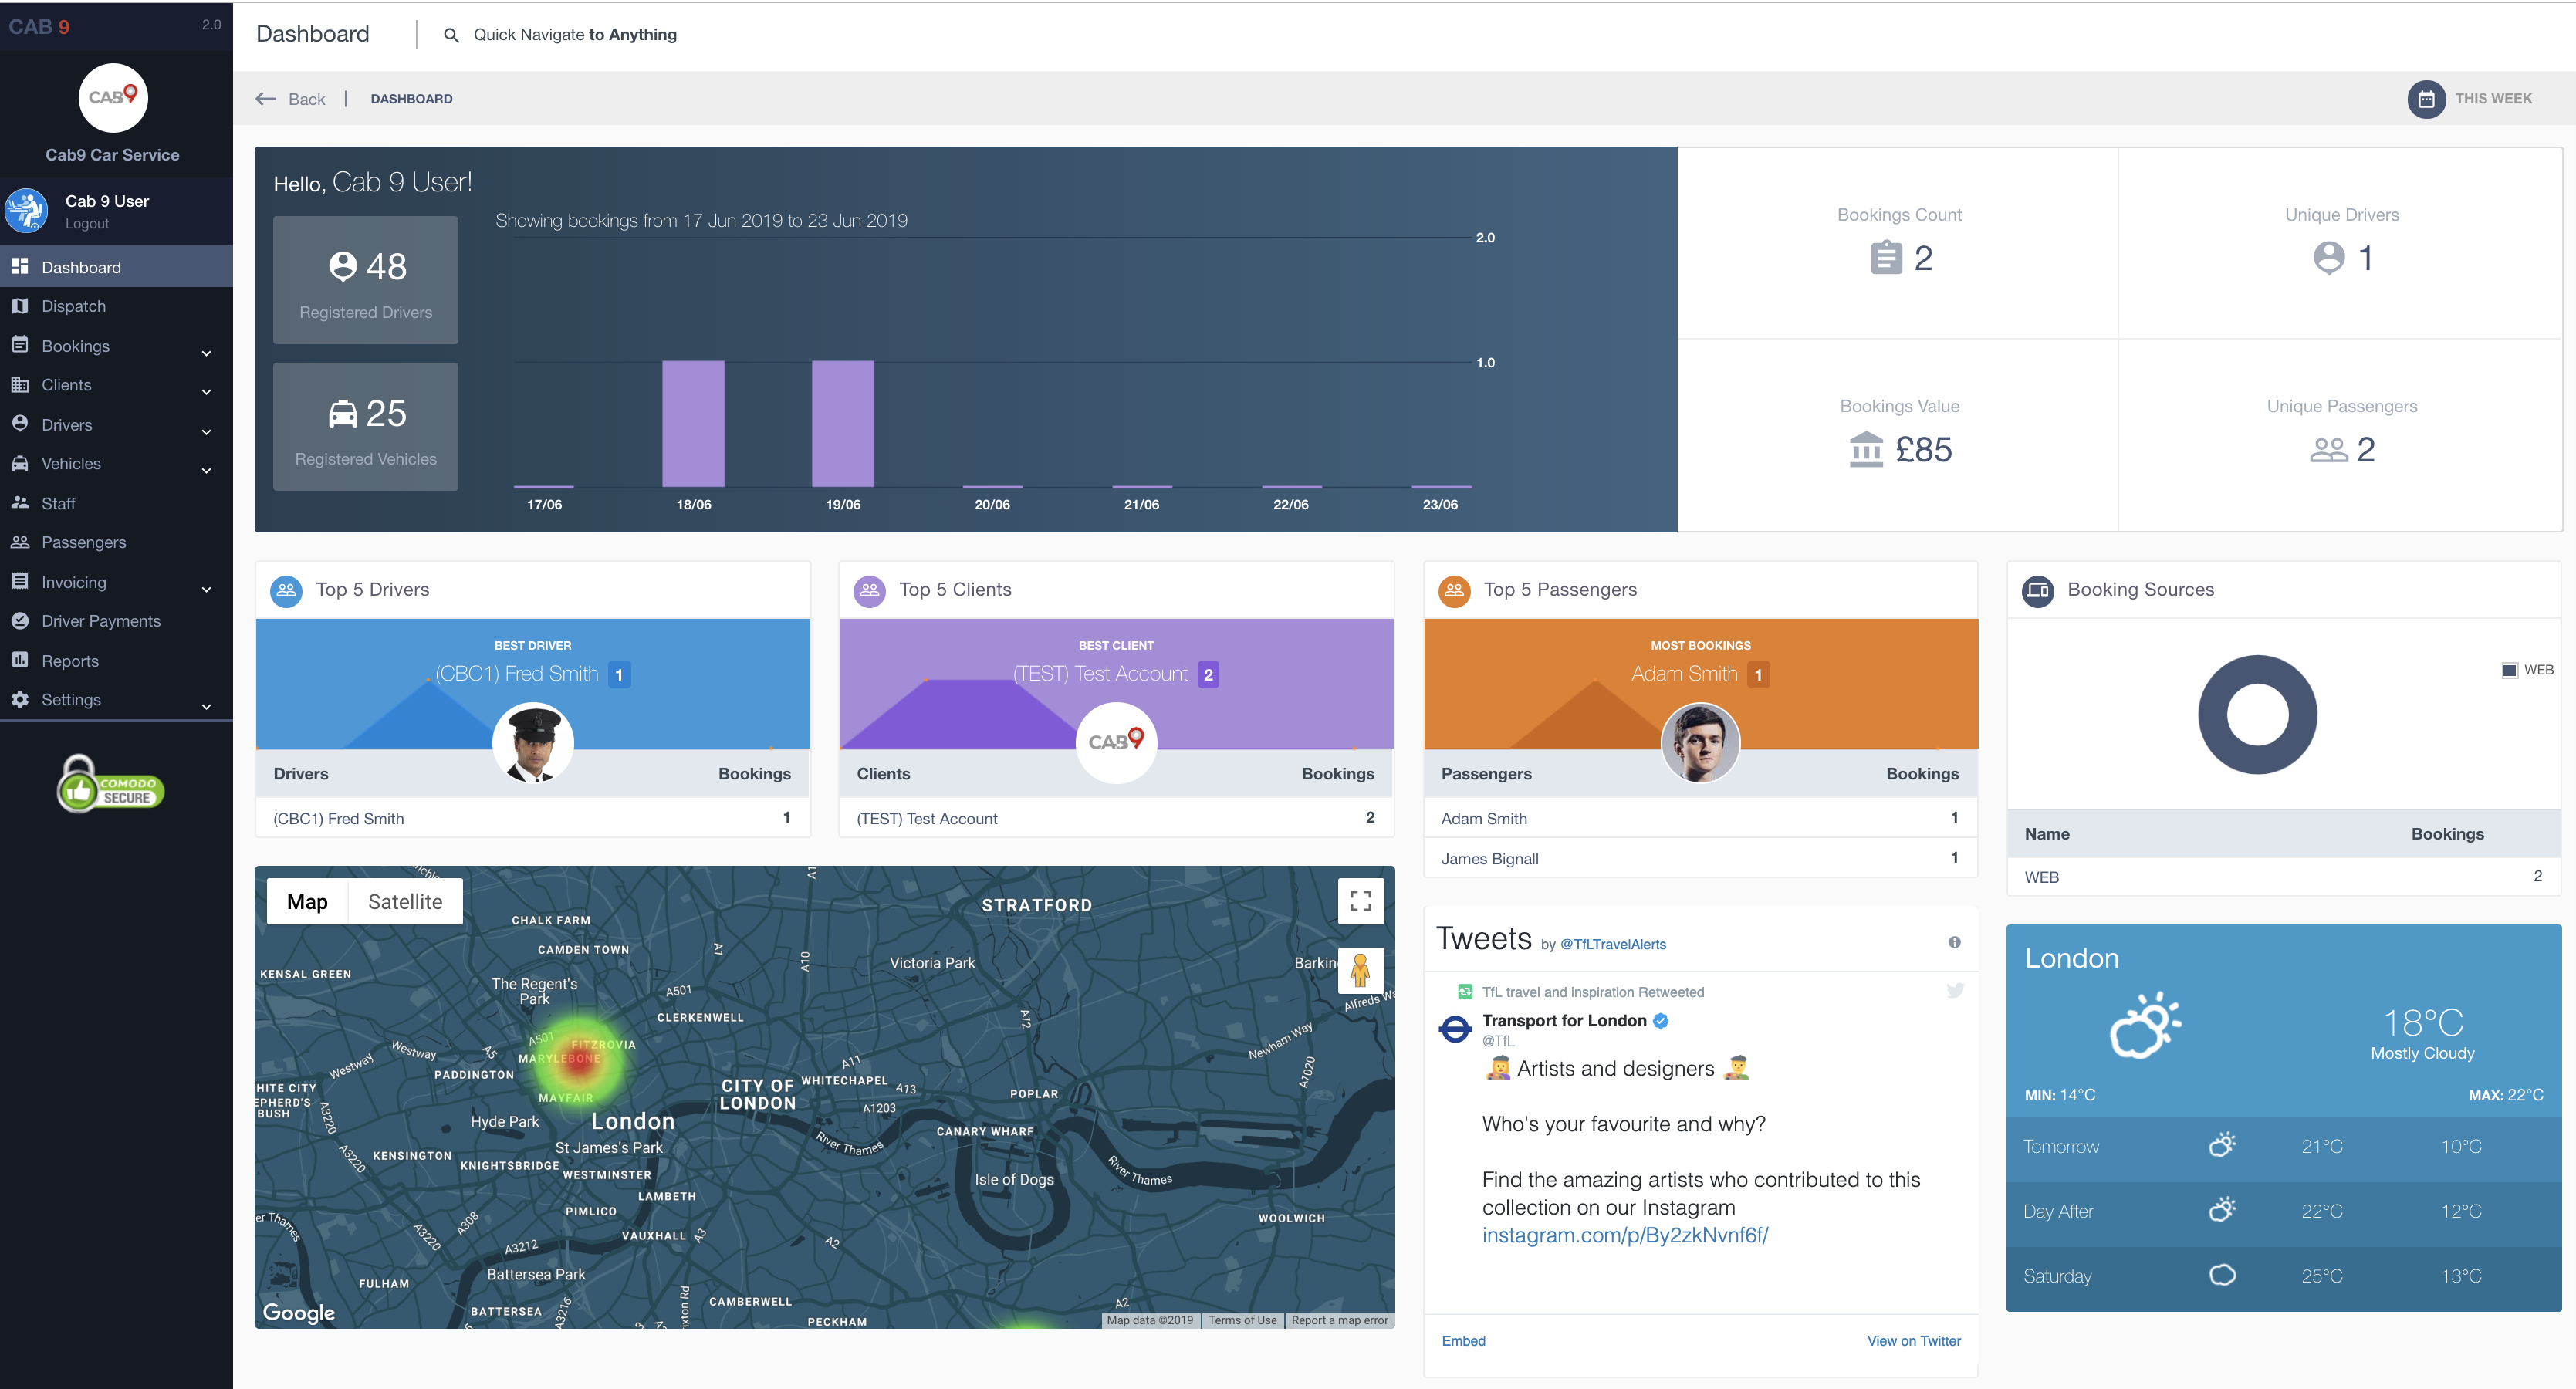
The Dashboard offers you a birds-eye view of your business.
2
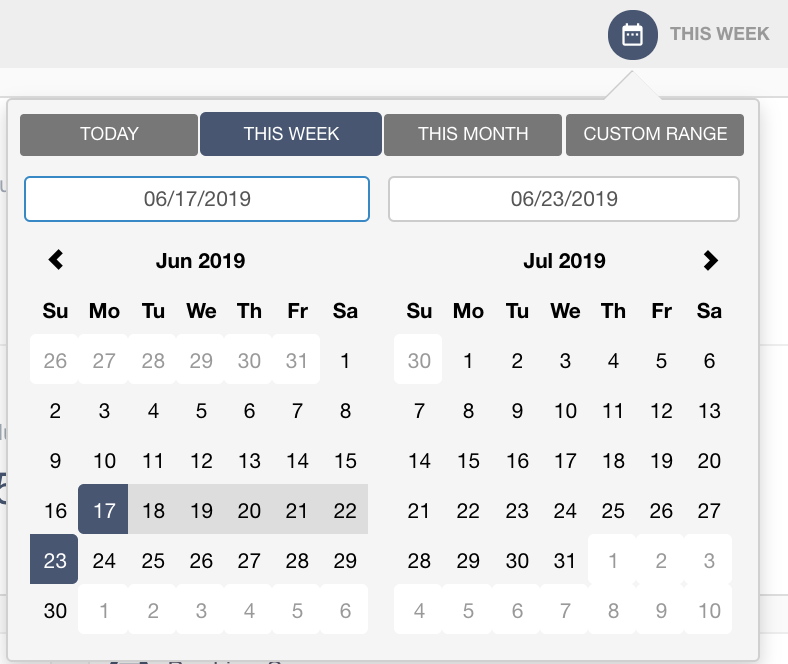
Date filter – you can view data for the period of time selected
3
Info Panes – below explains the information held in the info panes.
- Bookings – number of bookings taken in the selected period
- Unique Drivers – number of drivers used to cover bookings in the selected period
- Account Bookings Value – the value of account bookings taken in the selected period
- Unique Passengers – number of individual named passengers carried in the selected period
- Top 5 drivers – top 5 drivers who have completed the most bookings
- Top 5 clients – top 5 clients by bookings taken
- Top 5 passengers – top 5 passengers by bookings taken
- Booking Sources – Booking sources, web (Cab9 direct entry), Client Portal, App Bookings and any aggregators you may be connected to
- Heat Map – a heat map showing booking collections by area for the selected period
- Twitter Feed – your chosen twitter feed (often your own company)
- Weather Forecast – based on your operating centre address.
- Menu – And of course, to the left the menu structure.
Next Steps
- This article show where to navigate in order to manage vehicles.


